- Get in Touch with Us

Last Updated: Aug 13, 2026 | Study Period: 2026-2032
Built from defense capital-expenditure disclosures, military procurement budgets, prime contractor hardware architectures, and open-architecture standardization roadmaps (SOSA/FACE). The analysis addresses three buyer decisions: which computing architectures should transition to SOSA-aligned VPX, where AI-driven signal processing requires hardware acceleration, and how to modernize legacy EW mission processing units.
Calibrated estimate. Scope covers ruggedized embedded mission computers, digital signal processing (DSP) payloads, threat-location engines, modular open systems architecture (MOSA) VPX chassis, adaptive EW AI co-processors, and field support software for airborne, naval, ground, and space electronic warfare systems. It excludes raw semiconductor wafer fabrication, non-defense commercial computing, general hull/airframe utilities, and organic military personnel payroll.
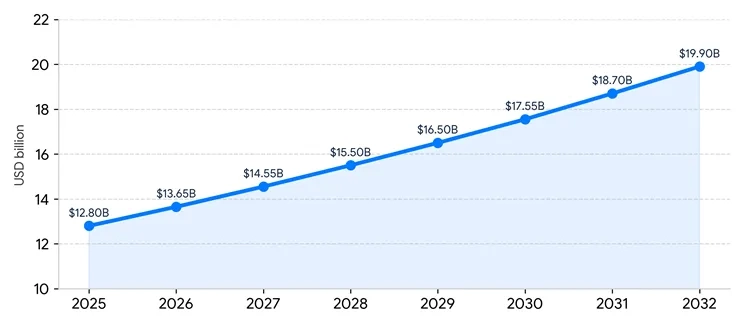
The 2025 midpoint is derived from an estimated $210-$235 billion global asset value for active electronic warfare payloads, radar warning receivers, signals intelligence (SIGINT) suites, and high-frequency RF countermeasures deployed across defense forces. An embedded mission computer spending factor of roughly 5.5%-6.2% is applied by system class, then adjusted for platform retrofit backlogs, COTS component availability, and active military procurement contracts. This produces a base-year range of $11.5-$14.2 billion.
Growth to 2032 is driven by fundamental shifts in spectrum contestation. Emerging peer-competitor threat environments mandate real-time signal processing, machine-learning target identification, and automated countermeasure selection.
Electronic warfare mission computers serve as the central processing backbone for modern electromagnetic spectrum operations (EMSO). They collect, filter, analyze, and respond to dense RF threat environments in real time. System scope encompasses ruggedized high-performance embedded computing (HPEC) chassis, FPGA-based signal processing units, multi-spectral sensor fusion engines, adaptive jamming controller units, optical fiber interconnects, and conduction-cooled power conversion modules. Supported platform assets include fighter aircraft, unmanned aerial vehicles (UAVs), surface warships, submarines, armored tactical vehicles, missile defense batteries, and space-based SIGINT satellites.
The market operates under severe environmental and operational constraints that distinguish it from industrial computing. EW mission computers must execute dense matrix multiplication and fast Fourier transforms (FFT) under extreme vibration, wide ambient temperature swings (-40°C to +85°C), high electromagnetic interference (EMI), and strict shock thresholds.
By 2032, EW mission computing will be dominated by cognitive AI architectures and software-defined, open-architecture hardware. While North America and NATO allies maintain the majority of advanced computing deployments, system integration and sovereign firmware development are expanding across Australia, South Korea, Japan, and India. Rapid field reprogrammability and open-system compliance become mandatory procurement criteria to prevent vendor lock-in and enable over-the-air threat profile updates within hours rather than month-long depot maintenance cycles.
Processing content per platform increases dramatically as optical backplanes, direct RF sampling FPGAs, and liquid-assisted cooling penetrate standard 3U/6U chassis designs. Leading COTS vendors are integrating dedicated neural processing units (NPUs) directly into conduction-cooled VPX cards to enable autonomous threat classification at the edge.
| Service | Adoption | 2025-2032 direction |
|---|---|---|
| SOSA/MOSA VPX Upgrades | Very High | Mandatory for new airborne and naval programs to ensure cross-vendor interoperability. |
| Conduction/Liquid Cooling Retrofits | High | Critical for high-density GPGPU payloads exceeding traditional air-cooled thermal envelopes. |
| Hardware Zeroization & Cybersecurity | Medium-High | Scaling across multi-domain platforms to prevent compromise of classified threat libraries. |
| Legacy Bus/Processor Emulation | Medium | Sustained requirement for aging airframes awaiting complete avionics glass-cockpit overhauls. |
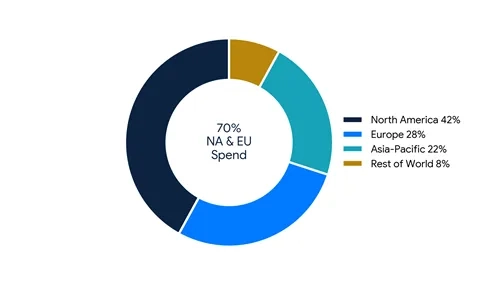
| Region | 2025 share | CAGR | Demand and service position |
|---|---|---|---|
| North America | 42% | 6.2% | Largest market; home to major prime defense OEMs and rigorous SOSA standard enforcement. |
| Europe | 28% | 5.8% | Strong growth driven by NATO defense spending targets and cross-border fighter jet modernization. |
| Asia-Pacific | 22% | 8.5% | Fastest-growing corridor; led by Japan, South Korea, Australia, and India expanding sovereign EW. |
| Middle East & Africa | 5% | 5.1% | High demand for tactical drone-defense mission processing and land-vehicle EW suites. |
| Latin America | 3% | 3.8% | Selective platform retrofits and border surveillance signals intelligence computing upgrades. |
| Platform Family | 2025 | 2032 | CAGR | Processing Demand |
|---|---|---|---|---|
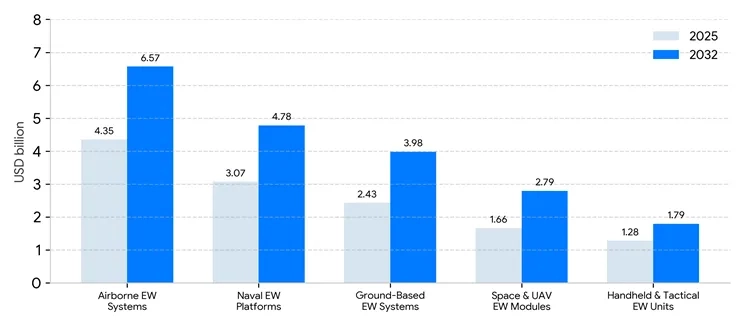
| Airborne EW Systems | $4.35B | $6.57B | 6.1% | Highest complexity; requires dense VPX cards and active optical interconnects. |
| Naval EW Platforms | $3.07B | $4.78B | 6.5% | High multi-target signal tracking density; large-chassis liquid-cooled arrays. |
| Ground-Based EW Systems | $2.43B | $3.98B | 7.3% | Rapid growth in C-UAS and tactical counter-ECM units; focus on SWaP-C. |
| Space & UAV EW Modules | $1.66B | $2.79B | 7.7% | Radiation-hardened miniaturized processors for autonomous swarm payloads. |
| Handheld & Tactical EW Units | $1.29B | $1.78B | 4.7% | Ultra-low power DSP units for squad-level threat detection and direction finding. |
| Provider Group | Representative Participants | Primary Service & Product Position |
|---|---|---|
| Tier-1 Prime Contractors | BAE Systems, Lockheed Martin, Northrop Grumman, Raytheon, L3Harris | Full EW system integration, classified threat software, end-to-end platform delivery. |
| Embedded COTS OEMs | Mercury Systems, Curtiss-Wright, Abaco Systems, Elma Electronic, Concurrent Tech | Ruggedized SOSA-aligned VPX cards, chassis, single-board computers, thermal management. |
| Specialist DSP & AI Vendors | EpiSys Science, Concurrent Real-Time, Annapolis Micro Systems, Dedicated Computing | High-speed FPGA modules, direct RF sampling engines, cognitive threat classification. |
| Regional Integrators & Depot Services | Indra Sistemas, Hensoldt, Bharat Electronics (BEL), ST Engineering | Local platform adaptation, Foreign Military Sales (FMS) support, depot-level MRO. |
Competitive advantage hinges on SOSA alignment, thermal efficiency per watt, sub-millisecond signal latency, and secure software stack integration rather than raw processing speed alone. Prime contractors lead system-level awards, while COTS providers compete vigorously on modular card-level performance and rapid delivery cycles.
| Segmentation | Coverage |
|---|---|
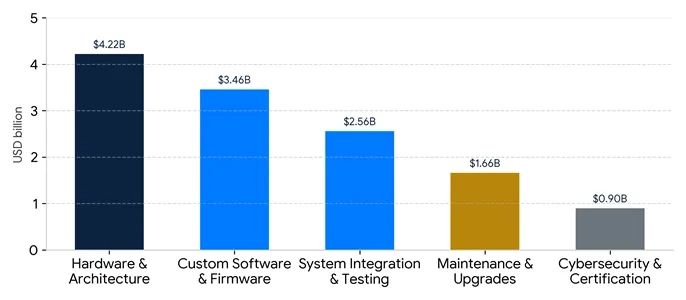
| By Service / Offering Type | Hardware & Processing Architecture; Custom Software & Firmware; System Integration & Testing; Life-cycle Maintenance & Upgrades; Cybersecurity & Certification. |
| By Platform Category | Airborne EW Systems; Naval EW Platforms; Ground-Based EW Systems; Space & UAV EW Modules; Handheld & Tactical EW Units. |
| By Architecture Standard | SOSA Aligned / VPX; Proprietary Bus Systems; CompactPCI / VME Legacy; MicroTCA / Custom Small Form Factor. |
| By End User | Air Force / Naval Aviation; Navy & Maritime Defense; Army / Ground Forces; Space Defense Commands; Special Operations Forces. |
| By Geography | North America; Europe; Asia-Pacific; Middle East & Africa; Latin America. |
The estimate uses a combined top-down defense budget analysis and bottom-up platform hardware mapping method. Global military aircraft, naval vessel, and land vehicle inventories are mapped against active EW modernization schedules. Base computer hardware costs are calibrated using public defense prime contractor disclosures, government contract award notices, and COTS supplier bill-of-material estimates. Processing factor models adjust for software content, system qualification, and life-cycle support costs.
Regional allocations draw from national defense budgets, SIPRI military expenditure tracking, major foreign military sales (FMS) notifications, and regional defense electronics industrial base density. Forecast CAGR calculations incorporate projected defense spending growth, threat environment escalation models, component obsolescence cycles, and technology insertion roadmaps.
The global electronic warfare mission computer market is undergoing a rapid transition toward high-density, open-architecture, AI-accelerated processing platforms. As the electromagnetic spectrum becomes increasingly contested, defense forces require agile computing systems capable of real-time cognitive threat response. Vendors that align product lines with SOSA/MOSA standards, solve extreme thermal dissipation challenges, and deliver secure, field-reprogrammable computing stacks will capture the dominant share of next-generation defense procurement contracts.
| Sr. No. | Topic |
|---|---|
| 1 | Market Segmentation |
| 2 | Scope of the Report |
| 3 | Research Methodology |
| 4 | Executive Summary |
| 5 | Key Predictions for the Global Electronic Warfare Mission Computers Market |
| 6 | Average B2B Pricing in the Electronic Warfare Mission Computers Market |
| 7 | Major Drivers in Electronic Warfare Mission Computers Market |
| 8 | Global Defense Electronic Warfare Installed Base and Service Footprint - 2025 |
| 9 | Technology Developments in Electronic Warfare Mission Computers |
| 10 | New Product and Solution Development in the Electronic Warfare Mission Computer Market |
| 11 | Research Focus In Electronic Warfare Mission Computer Architectures |
| 12 | Key Trends in the Electronic Warfare Mission Computers Market |
| 13 | Major Changes Expected in the Electronic Warfare Mission Computers Market |
| 14 | Government Defense Budgets and Their Impact on EW Mission Computer Demand |
| 15 | Recent Investments and Their Impact on the EW Mission Computer Market |
| 16 | Geopolitical Tension and Its Impact on Electronic Warfare Mission Computers Market |
| 17 | Market Size, Dynamics and Forecast, by Geography, 2025-2032 |
| 18 | Market Size, Dynamics and Forecast, by Service/Offering Type, 2025-2032 |
| 19 | Market Size, Dynamics and Forecast, by Platform Category, 2025-2032 |
| 20 | Market Size, Dynamics and Forecast, by End User, 2025-2032 |
| 21 | Competitive Landscape of the Electronic Warfare Mission Computers Market |
| 22 | Mergers, Acquisitions and Strategic Partnerships |
| 23 | Competitive Landscape |
| 24 | Growth Strategies of Leading Players |
| 25 | Market Share of EW Mission Computer Providers - 2025 |
| 26 | Company Profiles |
| 27 | Unmet Needs and Opportunities for New Market Entrants |
| 28 | Conclusion |
| Sr No | Topic |
|---|---|
| 1 | Market Segmentation |
| 2 | Scope of the report |
| 3 | Research Methodology |
| 4 | Executive summary |
| 5 | Key Predictions of Electronic Warfare Mission Computers Market |
| 6 | Avg B2B price of Electronic Warfare Mission Computers Market |
| 7 | Major Drivers For Electronic Warfare Mission Computers Market |
| 8 | Global Electronic Warfare Mission Computers Market Production Footprint - 2025 |
| 9 | Technology Developments In Electronic Warfare Mission Computers Market |
| 10 | New Product Development In Electronic Warfare Mission Computers Market |
| 11 | Research focuses on new Electronic Warfare Mission Computers |
| 12 | Key Trends in the Electronic Warfare Mission Computers Market |
| 13 | Major changes expected in Electronic Warfare Mission Computers Market |
| 14 | Incentives by the government for Electronic Warfare Mission Computers Market |
| 15 | Private investments and their impact on Electronic Warfare Mission Computers Market |
| 16 | Market Size, Dynamics, And Forecast, By Type, 2026-2032 |
| 17 | Market Size, Dynamics And Forecast, By Output, 2026-2032 |
| 18 | Market Size, Dynamics, And Forecast, By End User, 2026-2032 |
| 19 | Competitive Landscape Of Electronic Warfare Mission Computers Market |
| 20 | Mergers and Acquisitions |
| 21 | Competitive Landscape |
| 22 | Growth strategy of leading players |
| 23 | Market share of vendors, 2025 |
| 24 | Company Profiles |
| 25 | Unmet needs and opportunities for new suppliers |
| 26 | Conclusion |
© 2017-2026 Mobility Foresights Pvt Ltd. All rights reserved.
Developed with by ClousTech