- Get in Touch with Us

Last Updated: Apr 25, 2025 | Study Period: 2022-2027
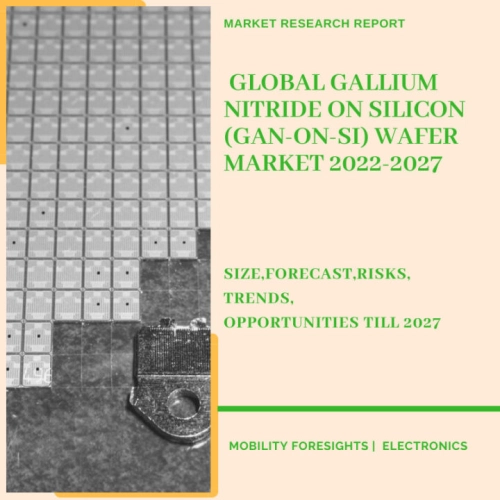
Gallium nitride on silicon is one of the greatest choices for semiconductor devices. This material can withstand far more energy and is more stable at greater temperatures than silicon.

As a result of this feature, it is a better option for high-frequency semiconductor applications. As a result, it is a more cost-effective semiconductor alternative in power-efficient devices. Gallium nitride on a silicon substrate can be the finest option if you need a high-frequency gadget.
TheGlobal Gallium Nitride On Silicon (GaN-on-Si) Wafer Marketaccounted for $XX Billion in 2021 and is anticipated to reach $XX Billion by 2027, registering a CAGR of XX% from 2022 to 2027.
The majority of LEDs today are made using expensive GaN-on-sapphire wafers. GaN-on-Si wafers are not only less expensive per square foot, but they also allow for larger wafer diameters, allowing normal silicon wafer processing lines to be used.
As a result, GaN-on-Si could play a key role in lowering LED production costs, allowing energy-efficient LED lighting to be used in more applications and markets.
| Sl no | Topic |
| 1 | Market Segmentation |
| 2 | Scope of the report |
| 3 | Abbreviations |
| 4 | Research Methodology |
| 5 | Executive Summary |
| 6 | Introduction |
| 7 | Insights from Industry stakeholders |
| 8 | Cost breakdown of Product by sub-components and average profit margin |
| 9 | Disruptive innovation in the Industry |
| 10 | Technology trends in the Industry |
| 11 | Consumer trends in the industry |
| 12 | Recent Production Milestones |
| 13 | Component Manufacturing in US, EU and China |
| 14 | COVID-19 impact on overall market |
| 15 | COVID-19 impact on Production of components |
| 16 | COVID-19 impact on Point of sale |
| 17 | Market Segmentation, Dynamics and Forecast by Geography, 2022-2027 |
| 18 | Market Segmentation, Dynamics and Forecast by Product Type, 2022-2027 |
| 19 | Market Segmentation, Dynamics and Forecast by Application, 2022-2027 |
| 20 | Market Segmentation, Dynamics and Forecast by End use, 2022-2027 |
| 21 | Product installation rate by OEM, 2022 |
| 22 | Incline/Decline in Average B-2-B selling price in past 5 years |
| 23 | Competition from substitute products |
| 24 | Gross margin and average profitability of suppliers |
| 25 | New product development in past 12 months |
| 26 | M&A in past 12 months |
| 27 | Growth strategy of leading players |
| 28 | Market share of vendors, 2022 |
| 29 | Company Profiles |
| 30 | Unmet needs and opportunity for new suppliers |
| 31 | Conclusion |
| 32 | Appendix |