- Get in Touch with Us

Last Updated: Aug 05, 2026 | Study Period: 2026-2032
Built from installed-capacity replacement-value modelling across methanol synthesis, coal-to-olefin (CTO), natural gas-to-methanol facilities, public capital-expenditure disclosures, official production data and chemical process licensor documentation. The analysis addresses three buyer decisions: which catalyst formulations should remain under OEM contract, where alternative vendor support can lower operational cost and which regional manufacturing locations require new local service coverage.
Calibrated estimate. Scope covers copper-zinc-alumina catalysts, precious metal catalysts, loading/unloading services, in-situ activation, regeneration, passivating, and technical monitoring services for methanol synthesis reactors. It excludes upstream syngas generation assets, downstream MTO/MTG processing equipment, utility units, and internal maintenance labor costs.
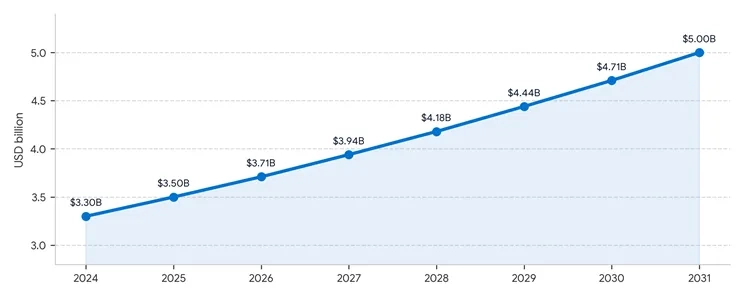
The 2024 midpoint is derived from an estimated $66–$74 billion replacement value for in-scope methanol synthesis reactors, internals, and initial charge inventory. A catalyst MRO/replacement factor of roughly 4.3%–5.0% is applied by reactor class, then adjusted for multi-year charge lifetimes, turnarounds, and plant capacity utilization. This produces a base-year range of $3.0–$3.7 billion.
Growth to 2031 is not primarily a simple chemical volume story. New production geography expands the catalyst service footprint. Low-carbon green methanol, direct CO2 hydrogenation, and high-pressure reactor designs raise catalyst performance intensity.
Remote process diagnostics, online gas chromatography monitoring, and life-extension services also move spend from routine replacement toward performance-guaranteed contracts. Inflation and higher-value active metal formulations support the value forecast, while mature Chinese coal-to-methanol utilization limits upside.
Global methanol synthesis catalyst and associated technical services keep syngas conversion assets operational, selective, and efficient after commissioning. The scope includes planned catalyst replacement, pre-reduction services, reactor loading/unloading, temperature profile optimization, spent catalyst recycling, digital performance tracking, and efficiency retrofits. Covered assets include fixed-bed tubular reactors, fluid-bed reactors, multi-stage adiabatic converters, gas-cooled reactors, and advanced carbon-capture integration loops.
The market is structurally different from standard bulk chemical supply. Methanol synthesis loops operate under demanding thermal and pressure regimes with tight selectivity margins. They face feed gas composition swings, sulfur/metal poisoning risks, and thermal sintering challenges.
A catalyst changeout intervention must restore target per-pass conversion without increasing operational pressure drop, byproduct formation (paraffins, higher alcohols), or thermal runaway risks. For this reason, plant operators separate basic physical unloading work from high-complexity OEM-guided catalyst loading and reduction.
By 2031, catalyst delivery will be more regionalized and digital-enabled. China remains the largest revenue pool, but service-network additions concentrate in India, Vietnam, and Middle Eastern petrochemical corridors. Regional catalyst staging hubs and local technical support become critical contract requirements because cross-border technician dispatch cannot meet urgent turnaround windows.
Service content per reactor charge rises as plant operators integrate real-time temperature mapping, stream analysis, and predictive deactivation modeling. Major licensors market remote monitoring platforms to optimize synthesis temperatures and extend charge lifetime, while specialized vendors offer automated dense-loading equipment, zero-emission unloading, and green catalyst recycling pathways. The commercial shift is toward availability and efficiency-based guarantees, though feed purity variations and catalyst liability rules pace full risk-sharing adoption.
| Service | Adoption | 2024–2031 direction |
|---|---|---|
| Preventive maintenance & monitoring | Very High | Mandatory for temperature control, pressure drop management, and poison guard beds. |
| Corrective replacement & changeout | Very High | Required across aging synthesis loops, with operators demanding faster turnaround SLAs. |
| Calibration & technical qualification | High | Growing with e-methanol, CO2 hydrogenation, and high-efficiency synthesis loops. |
| Remote performance diagnostics | High | Reduces plant downtime and optimizes kinetics; adoption depends on DCS integration and data security. |
| Predictive deactivation modeling | Medium-High | Scaling where online GC logs and multi-point thermocouple data are standardized. |
| Independent spent recovery & overhaul | Medium | Attractive for precious metal recovery, but constrained by proprietary formulation patents. |
| Region | 2024 share | CAGR | Demand and service position |
|---|---|---|---|
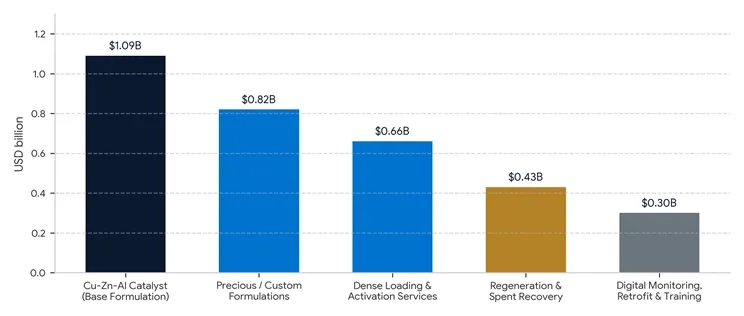
| China | 49% | 3%–4% | Largest installed base; mature coal-to-methanol capacity and strong primary OEM coverage. High catalyst consumption density. |
| India | 10% | 11%–13% | New green synthesis capacity, coal gasification expansion, and domestic production mandates driving growth. |
| Southeast Asia | 14% | 9%–11% | Export-focused production hubs (Malaysia, Indonesia); regional logistics hubs expanding for turnaround support. |
| Other Asia-Pacific | 17% | 5%–7% | Japan, South Korea, and Taiwan lead advanced e-methanol research, specialized catalyst development, and technology licensors. |
| Rest of world | 10% | 2%–4% | North American gas-based methanol hubs and Middle Eastern mega-plants; focus on long catalyst life and high thermal efficiency. |
| Equipment / Application | 2024 | 2031 | CAGR | Service demand |
|---|---|---|---|---|
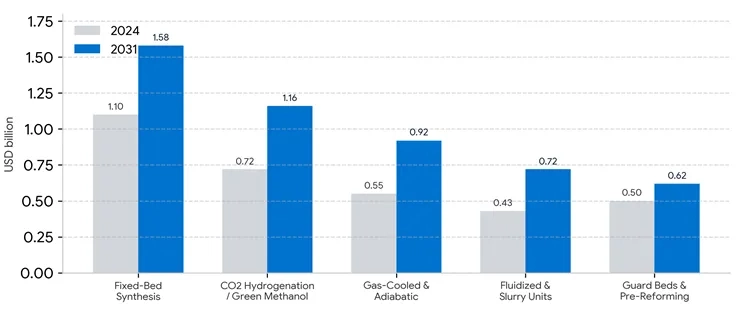
| Fixed-Bed Synthesis Loop | $1.10B | $1.58B | 5.3% | Largest pool; pellet/extrudate replacement, distribution plates, and thermal monitoring. |
| CO2 Hydrogenation / Green Methanol | $0.72B | $1.16B | 7.1% | High-activity precious/specialty catalysts requiring specialized activation. |
| Gas-Cooled & Adiabatic Converters | $0.55B | $0.92B | 7.6% | High thermal load management, multi-stage loading, and pressure drop control. |
| Fluidized & Slurry Reactors | $0.43B | $0.72B | 7.7% | Continuous catalyst withdrawal, attrition resistance, and fine powder handling. |
| Poison Guard & Pre-Reforming Units | $0.50B | $0.62B | 3.1% | Guard bed replacement (sulfur/chlorine traps) to preserve main catalyst charge. |
| Provider group | Representative participants | Primary service position |
|---|---|---|
| Primary Catalyst OEMs | Clariant, Johnson Matthey, Haldor Topsoe, BASF, Mitsubishi Gas Chemical | Proprietary formulations, process licensing integration, pre-reduction, and master technical support. |
| Petrochemical Licensors | Casale, Air Liquide (Lurgi), Toyo Engineering, Technip Energies | Integrated loop design, reactor supply, catalyst specification, and performance guarantees. |
| Specialist Service Providers | Mourik, Cat Tech, Anabelea, Johnson Matthey Catalyst Care | Dense loading, zero-emission nitrogen turnaround handling, activation, and spent removal. |
| Metal Recovery Specialists | Heraeus, Sabin Metal, Johnson Matthey Recycling, regional recyclers | Spent catalyst reclamation, copper/zinc separation, precious metal refining, and waste management. |
Competitive advantage comes from active site formulation IP, turnaround execution speed, and thermal stability guarantees. OEMs lead high-complexity reactor charges, while specialized chemical service firms win turnaround handling contracts based on speed and safety.
| Segmentation | Coverage |
|---|---|
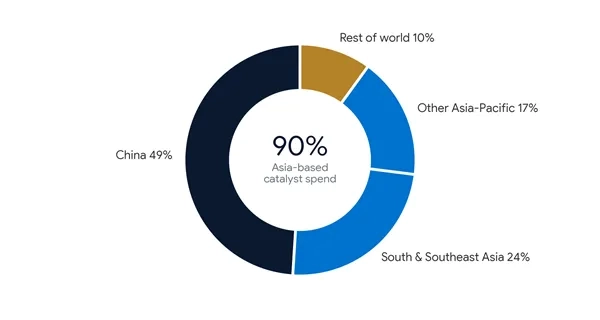
| By Service & Material Type | Cu-Zn-Al base catalysts; precious metal & novel catalysts; dense loading & pre-reduction; regeneration & recovery; digital monitoring. |
| By Reactor Technology | Fixed-bed tubular converters; multi-stage adiabatic reactors; gas-cooled synthesis loops; fluidized/slurry bed systems. |
| By Provider Type | Primary catalyst OEM; chemical process licensor; independent turnaround specialist; metal reclamation provider. |
| By Contract Model | Direct catalyst sale; long-term supply agreement (LTSA); performance-guaranteed contract; chemical leasing model. |
| By Geography | China; India; Southeast Asia (Malaysia, Indonesia); Middle East; North America; Europe; Rest of World. |
The estimate uses a bottom-up installed-capacity method. Synthesis reactor technology families are mapped to global methanol production units, coal gasification complexes, and green synthesis initiatives. Replacement value is estimated from public chemical OEM filings, producer capital expenditure disclosures, refinery turnaround schedules, and trade flow data. Each reactor class receives an annual catalyst consumption factor based on active thermal degradation, syngas purity, pressure drop profiles, and expected charge lifespan (typically 3-5 years).
Regional allocation uses installed methanol synthesis capacity, coal vs. natural gas feedstock distribution, active plant construction, and service hub locations. Forecast rates reflect clean fuel mandates, green methanol project pipelines, reactor modernization, and active metal material pricing. Provider shares and service segment values represent analyst estimates based on industry interviews and licensor market footprints.
The methanol synthesis catalyst market is transitioning from simple material procurement toward integrated catalyst lifecycle management and performance guarantees. While China remains the largest volume market, green methanol projects in Europe and Asia-Pacific represent the primary technological growth frontier. Success among suppliers will belong to those offering high-selectivity formulations, rapid pre-reduction services, and verifiable carbon-footprint reductions across the catalyst lifecycle.
| Sr No | Topic |
|---|---|
| 1 | Market Segmentation |
| 2 | Scope of the report |
| 3 | Research Methodology |
| 4 | Executive summary |
| 5 | Key Predictions of Methanol Synthesis Catalyst Market |
| 6 | Avg B2B price of Methanol Synthesis Catalyst Market |
| 7 | Major Drivers For Methanol Synthesis Catalyst Market |
| 8 | Global Methanol Synthesis Catalyst Market Production Footprint - 2025 |
| 9 | Technology Developments In Methanol Synthesis Catalyst Market |
| 10 | New Product Development In Methanol Synthesis Catalyst Market |
| 11 | Research focuses on new Methanol Synthesis Catalyst |
| 12 | Key Trends in the Methanol Synthesis Catalyst Market |
| 13 | Major changes expected in Methanol Synthesis Catalyst Market |
| 14 | Incentives by the government for Methanol Synthesis Catalyst Market |
| 15 | Private investments and their impact on Methanol Synthesis Catalyst Market |
| 16 | Market Size, Dynamics, And Forecast, By Type, 2026-2032 |
| 17 | Market Size, Dynamics And Forecast, By Output, 2026-2032 |
| 18 | Market Size, Dynamics, And Forecast, By End User, 2026-2032 |
| 19 | Competitive Landscape Of Methanol Synthesis Catalyst Market |
| 20 | Mergers and Acquisitions |
| 21 | Competitive Landscape |
| 22 | Growth strategy of leading players |
| 23 | Market share of vendors, 2025 |
| 24 | Company Profiles |
| 25 | Unmet needs and opportunities for new suppliers |
| 26 | Conclusion |
© 2017-2026 Mobility Foresights Pvt Ltd. All rights reserved.
Developed with by ClousTech