
- Get in Touch with Us
Last Updated: Apr 25, 2025 | Study Period: 2022-2030
The level of an earthquake's impact on the ground and all types of structures is referred to as seismic intensity.
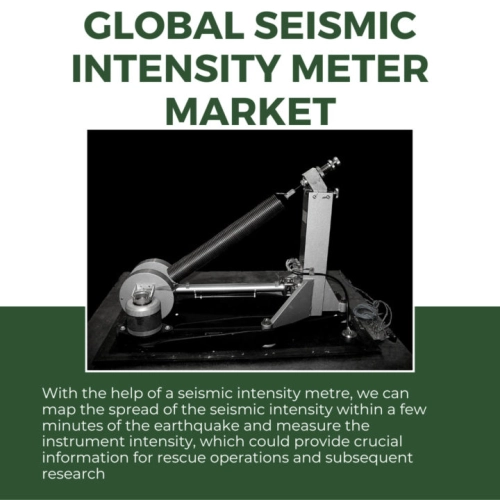
With the help of a seismic intensity metre, we can map the spread of the seismic intensity within a few minutes of the earthquake and measure the instrument intensity, which could provide crucial information for rescue operations and subsequent research.
Traditional seismic intensity metres are bulky and need fixing to a specific spot, which makes them unsuitable for intensive observations over a large area despite having superior observation precision.
The application of MEMS (Micro-Electro-Mechanical Systems) acceleration sensors for seismic observation has emerged as the primary developing area with the advancement of microelectronics technology.
The Global Seismic Intensity Meter market accounted for $XX Billion in 2021 and is anticipated to reach $XX Billion by 2030, registering a CAGR of XX% from 2022 to 2030.
By modifying the Modified Mercalli seismic intensity calculation method, G401 determines seismic intensity. G401 enables the use of contact outputs by seismic intensity or acceleration value to operate systems like factory machinery, gas valves, automatic doors, etc.
Additionally, G401 can be connected to a PC web browser, allowing for remote testing and operation of this intensity metre.
The SES70 Intelligent Earthquake Sensor by Azbil Corporation uses a small internal accelerometer to detect the acceleration brought on by an earthquake.
It then computes and outputs the synthetic acceleration, the estimated seismic intensity scale value (shindo scale) from the Japan Meteorological Agency, and the SI value, which represents an estimate of the structural damage brought on by earthquake motion.
| Sl no | Topic |
| 1 | Market Segmentation |
| 2 | Scope of the report |
| 3 | Abbreviations |
| 4 | Research Methodology |
| 5 | Executive Summary |
| 6 | Introduction |
| 7 | Insights from Industry stakeholders |
| 8 | Cost breakdown of Product by sub-components and average profit margin |
| 9 | Disruptive innovation in the Industry |
| 10 | Technology trends in the Industry |
| 11 | Consumer trends in the industry |
| 12 | Recent Production Milestones |
| 13 | Component Manufacturing in US, EU and China |
| 14 | COVID-19 impact on overall market |
| 15 | COVID-19 impact on Production of components |
| 16 | COVID-19 impact on Point of sale |
| 17 | Market Segmentation, Dynamics and Forecast by Geography, 2022-2030 |
| 18 | Market Segmentation, Dynamics and Forecast by Product Type, 2022-2030 |
| 19 | Market Segmentation, Dynamics and Forecast by Application, 2022-2030 |
| 20 | Market Segmentation, Dynamics and Forecast by End use, 2022-2030 |
| 21 | Product installation rate by OEM, 2022 |
| 22 | Incline/Decline in Average B-2-B selling price in past 5 years |
| 23 | Competition from substitute products |
| 24 | Gross margin and average profitability of suppliers |
| 25 | New product development in past 12 months |
| 26 | M&A in past 12 months |
| 27 | Growth strategy of leading players |
| 28 | Market share of vendors, 2022 |
| 29 | Company Profiles |
| 30 | Unmet needs and opportunity for new suppliers |
| 31 | Conclusion |
| 32 | Appendix |


© 2017-2026 Mobility Foresights Pvt Ltd. All rights reserved.
Developed with by ClousTech