- Get in Touch with Us

Last Updated: Apr 26, 2025 | Study Period: 2024-2030
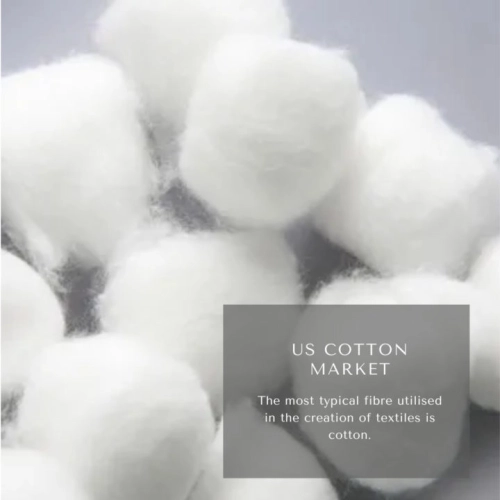
The most typical fibre utilised in the creation of textiles is cotton. Around the cotton plant's seeds, the commodity cotton grows like a ball.The most popular natural fibre in the world is cotton, which is produced.

Cotton output, consumption, and prices are frequently addressed in terms of crop years, just like other agricultural commodities.
The US cotton market accounted for $XX Billion in 2023 and is anticipated to reach $XX Billion by 2030, registering a CAGR of XX% from 2024 to 2030.
U.S. cotton exports are at their lowest level in recent years. U.S. cotton shipments are lower than the marketing year and down 100,000 bales from the projection from the previous month.
Lower exports are a result of the United States' production expected to drop from the prior year, the lowest level in seven years. In Texas, where 40% of American cotton is produced, high temperatures and a drought have reduced output and exportable supply.
The world's trade is less than expected. Nevertheless, the United States continues to be the world's top cotton exporter. Given that the United States already exports more than three-quarters of its crop, ending stocks would be at their lowest level if achieved.
According to U.S. export sales data, unfulfilled orders and shipments represent more than half of the planned output. China is anticipated to be the leading consumer for the third straight year, down from almost one-third the previous marketing year.
The predicted U.S. crop has been supported by a strong projected farm price since the ratio of shipping and sales to that crop is at its greatest level in a number of years.
Despite a predicted decline of 6 cents this month to 90 cents a pound for the projected U.S. season-average farm price, if achieved, this would rank as the second-highest level ever.
Cotton prices have fallen in recent weeks as investors become concerned about Chinese demand. China is the world's largest consumer of cotton, and its demand for cotton has been declining in recent years. This decline in demand is due to a number of factors, including the slowing Chinese economy and the increasing use of synthetic fibers in China's textile industry.
The US cotton industry has applauded the USDA for promoting sustainable farming practices. The USDA has recently announced a number of programs that are designed to help farmers adopt sustainable farming practices. These programs include the Conservation Stewardship Program and the Environmental Quality Incentives Program.
The Farm Bill is a comprehensive agricultural legislation that provides support to farmers, including cotton farmers. The Farm Bill includes a variety of programs, such as crop insurance, price supports, and conservation payments.
The Cotton Trust Fund is a government-funded program that promotes the development and use of US cotton. The Cotton Trust Fund is funded by a fee on cotton imports.
| Sl no | Topic |
| 1 | Market Segmentation |
| 2 | Scope of the report |
| 3 | Research Methodology |
| 4 | Executive Summary |
| 5 | Potential Opportunities for Client |
| 6 | Overview of the US cotton market |
| 7 | Insights from Industry stakeholders |
| 8 | Price trends in the U.S. cotton market and influencing factors. |
| 9 | Technology trends in the Industry |
| 10 | Consumer trends in the industry |
| 11 | Recent Production Milestones |
| 12 | Technological advancements in cotton farming and processing. |
| 13 | Role of biotechnology and genetic modifications in cotton cultivation. |
| 14 | Regional environmental conditions and their effects on cotton yield. |
| 15 | Key government policies, subsidies, and regulations affecting the U.S. cotton industry. |
| 16 | New product development in past 12 months |
| 17 | Market Segmentation, Dynamics and Forecast by Geography, 2024-2030 |
| 18 | Market Segmentation, Dynamics and Forecast by Cotton Type, 2024-2030 |
| 19 | Market Segmentation, Dynamics and Forecast by Application, 2024-2030 |
| 20 | Market Segmentation, Dynamics and Forecast by End use, 2024-2030 |
| 21 | Gross margin and average profitability of suppliers |
| 22 | M&A in past 12 months |
| 23 | Growth strategy of leading players |
| 24 | Market share of vendors, 2023 |
| 25 | Company Profiles |
| 26 | Unmet needs and opportunity for new suppliers |
| 27 | Conclusion |